See exactly where your credits go

Understand which models are driving costs, who's using what, predict future spend, and compare what you would have spent with different models.
Per-token costs are rising, and tokenmaxxing is out (good riddance). And as more and more teams integrate agents into their work, admins are less concerned with "How can we get our people to start using agents?" and more concerned with "How can we ensure our team uses their agents in the most cost-effective and efficient way?"
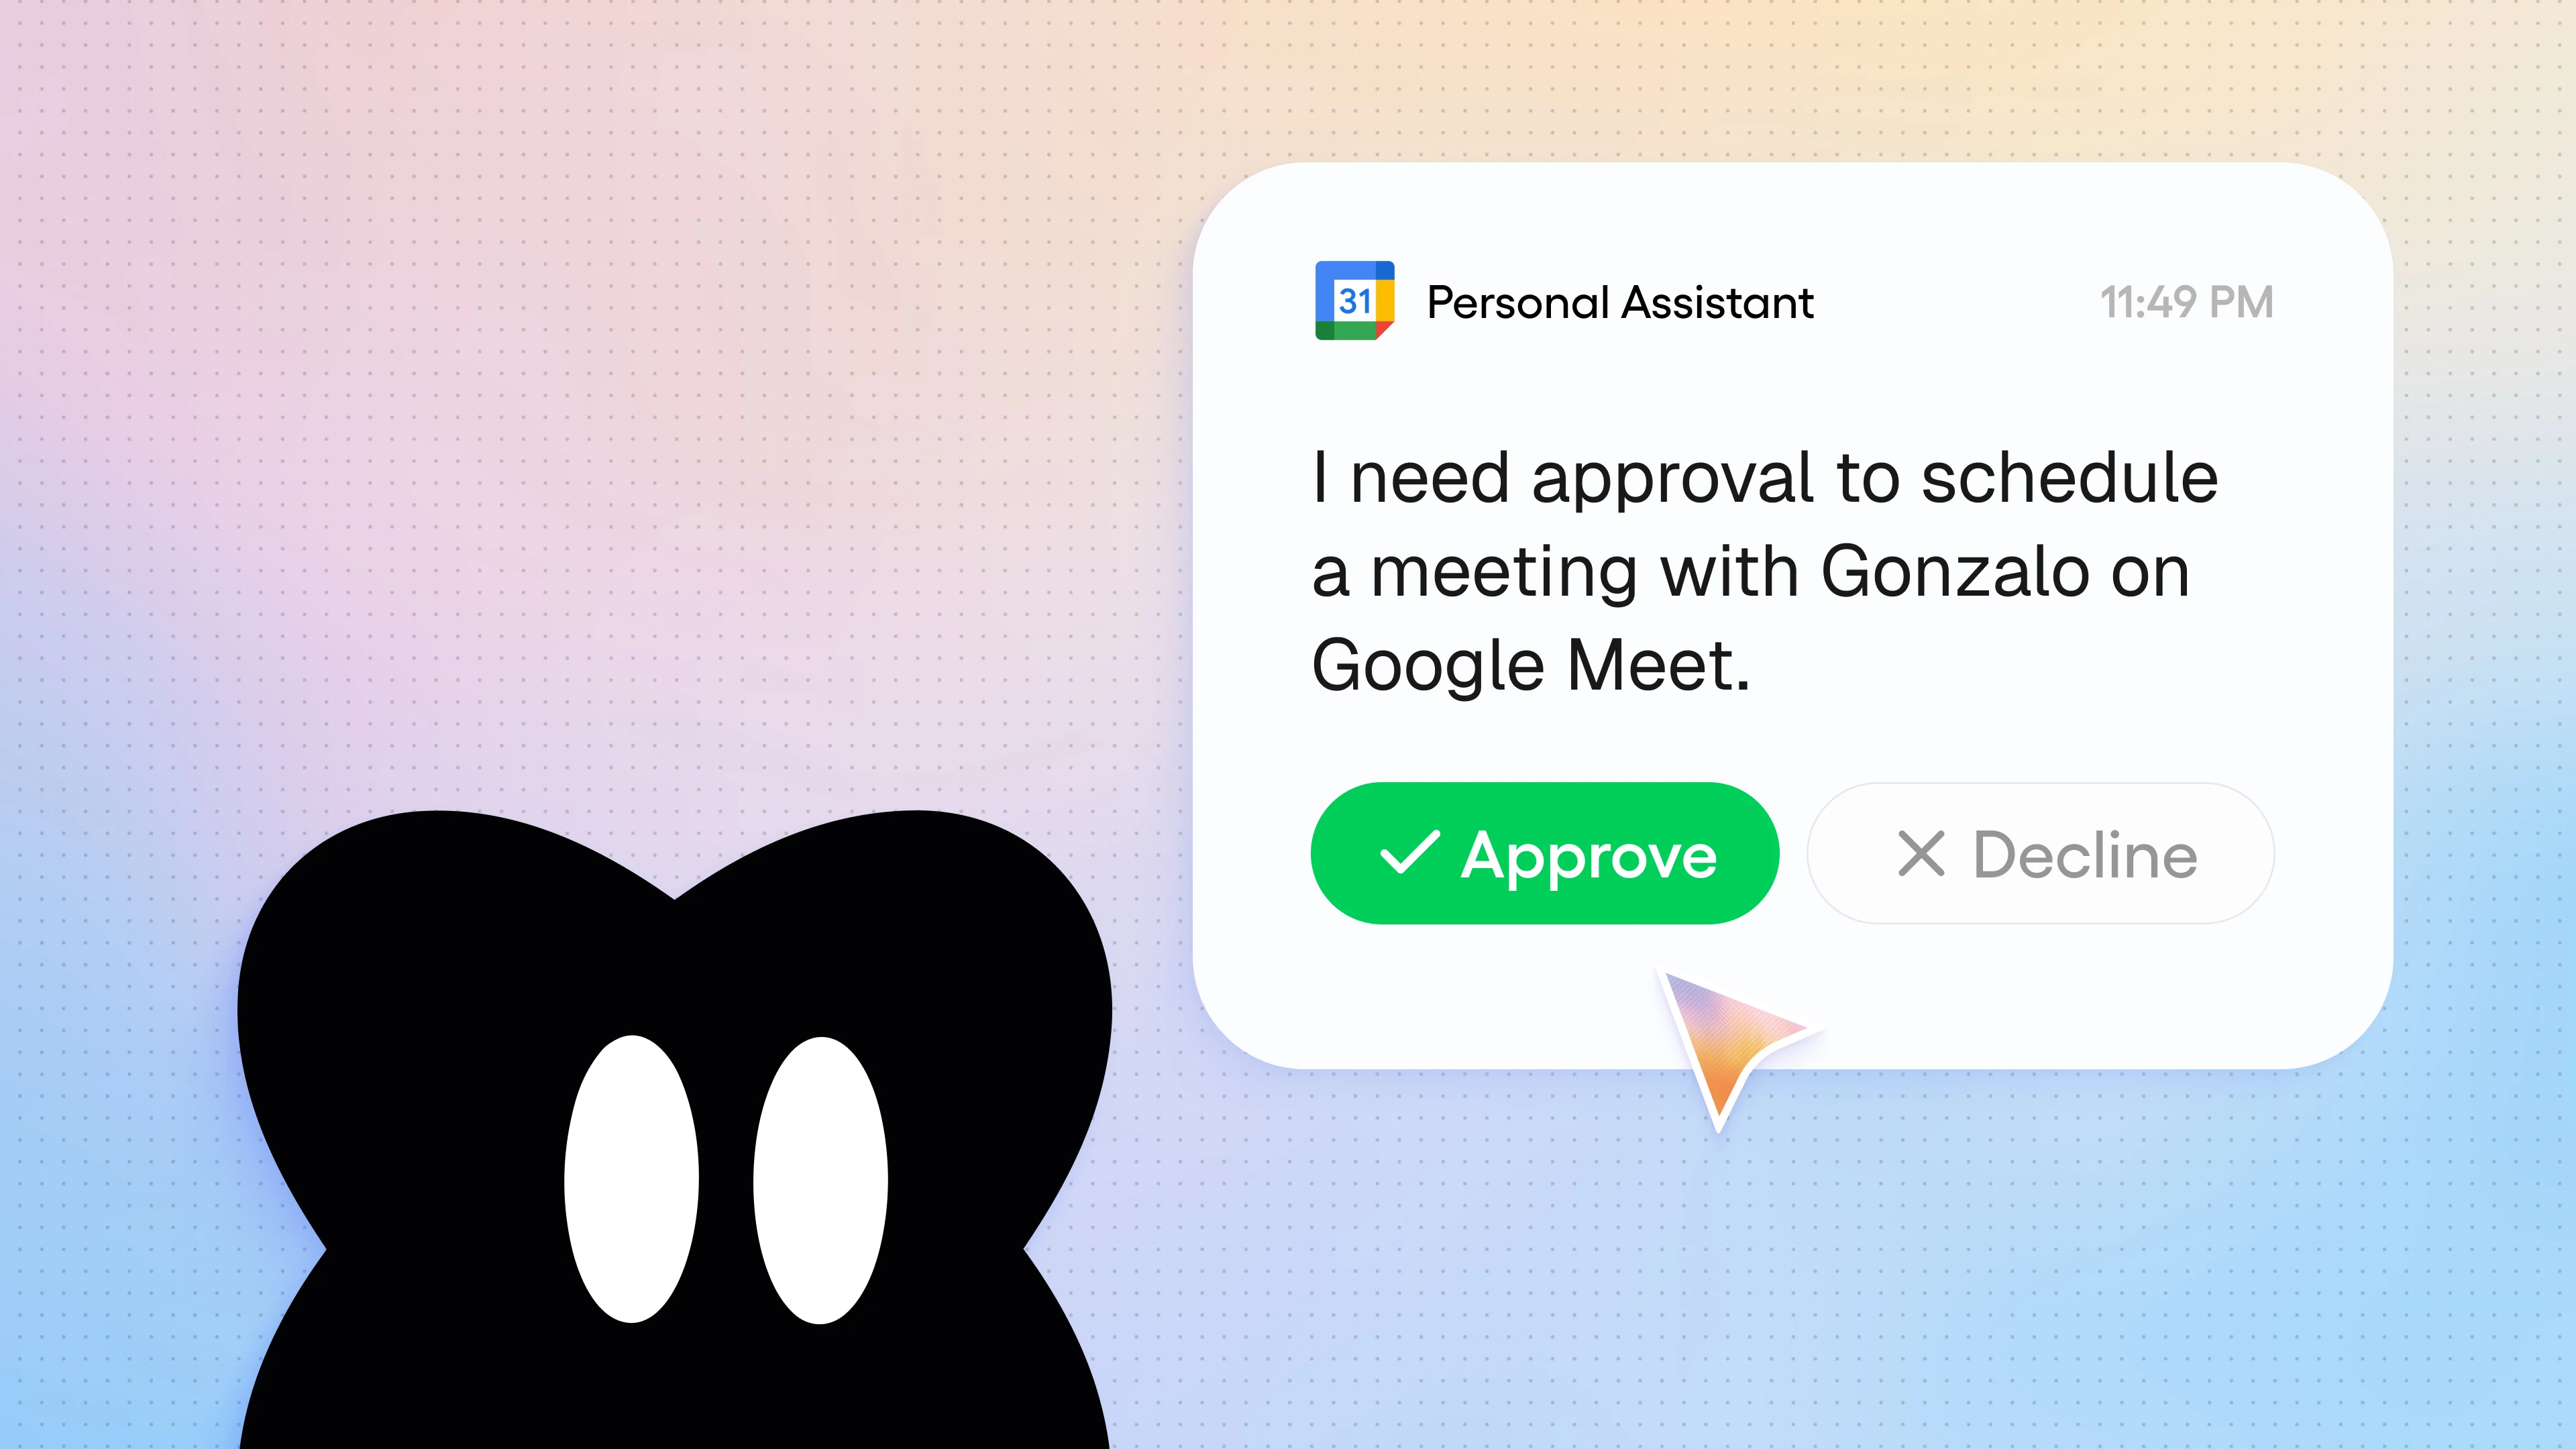
For our Enterprise customers, we’ve just introduced Insights, an analytics dashboard that gives you full visibility into how your organization uses Gumloop. Find out which agents and models are driving most of your spend, see who's actually adopting agents, and project next quarter's budget based on your real usage data. You can even calculate exactly how much a different model would have increased or decreased your credit spend.
This observability means that you can better understand where your credits are going and optimize your team’s costs. Chew through tasks, not tokens.
Get an overview at a glance
When first you enter the Insights panel, the first thing you see is a one-sentence overview of your organization’s credit consumption trends over the selected time period: for example, "You spent X credits, down Y% versus the last 30 days. Claude 4.6 Sonnet and Gemini 3.5 Flash drove Z% of spend."
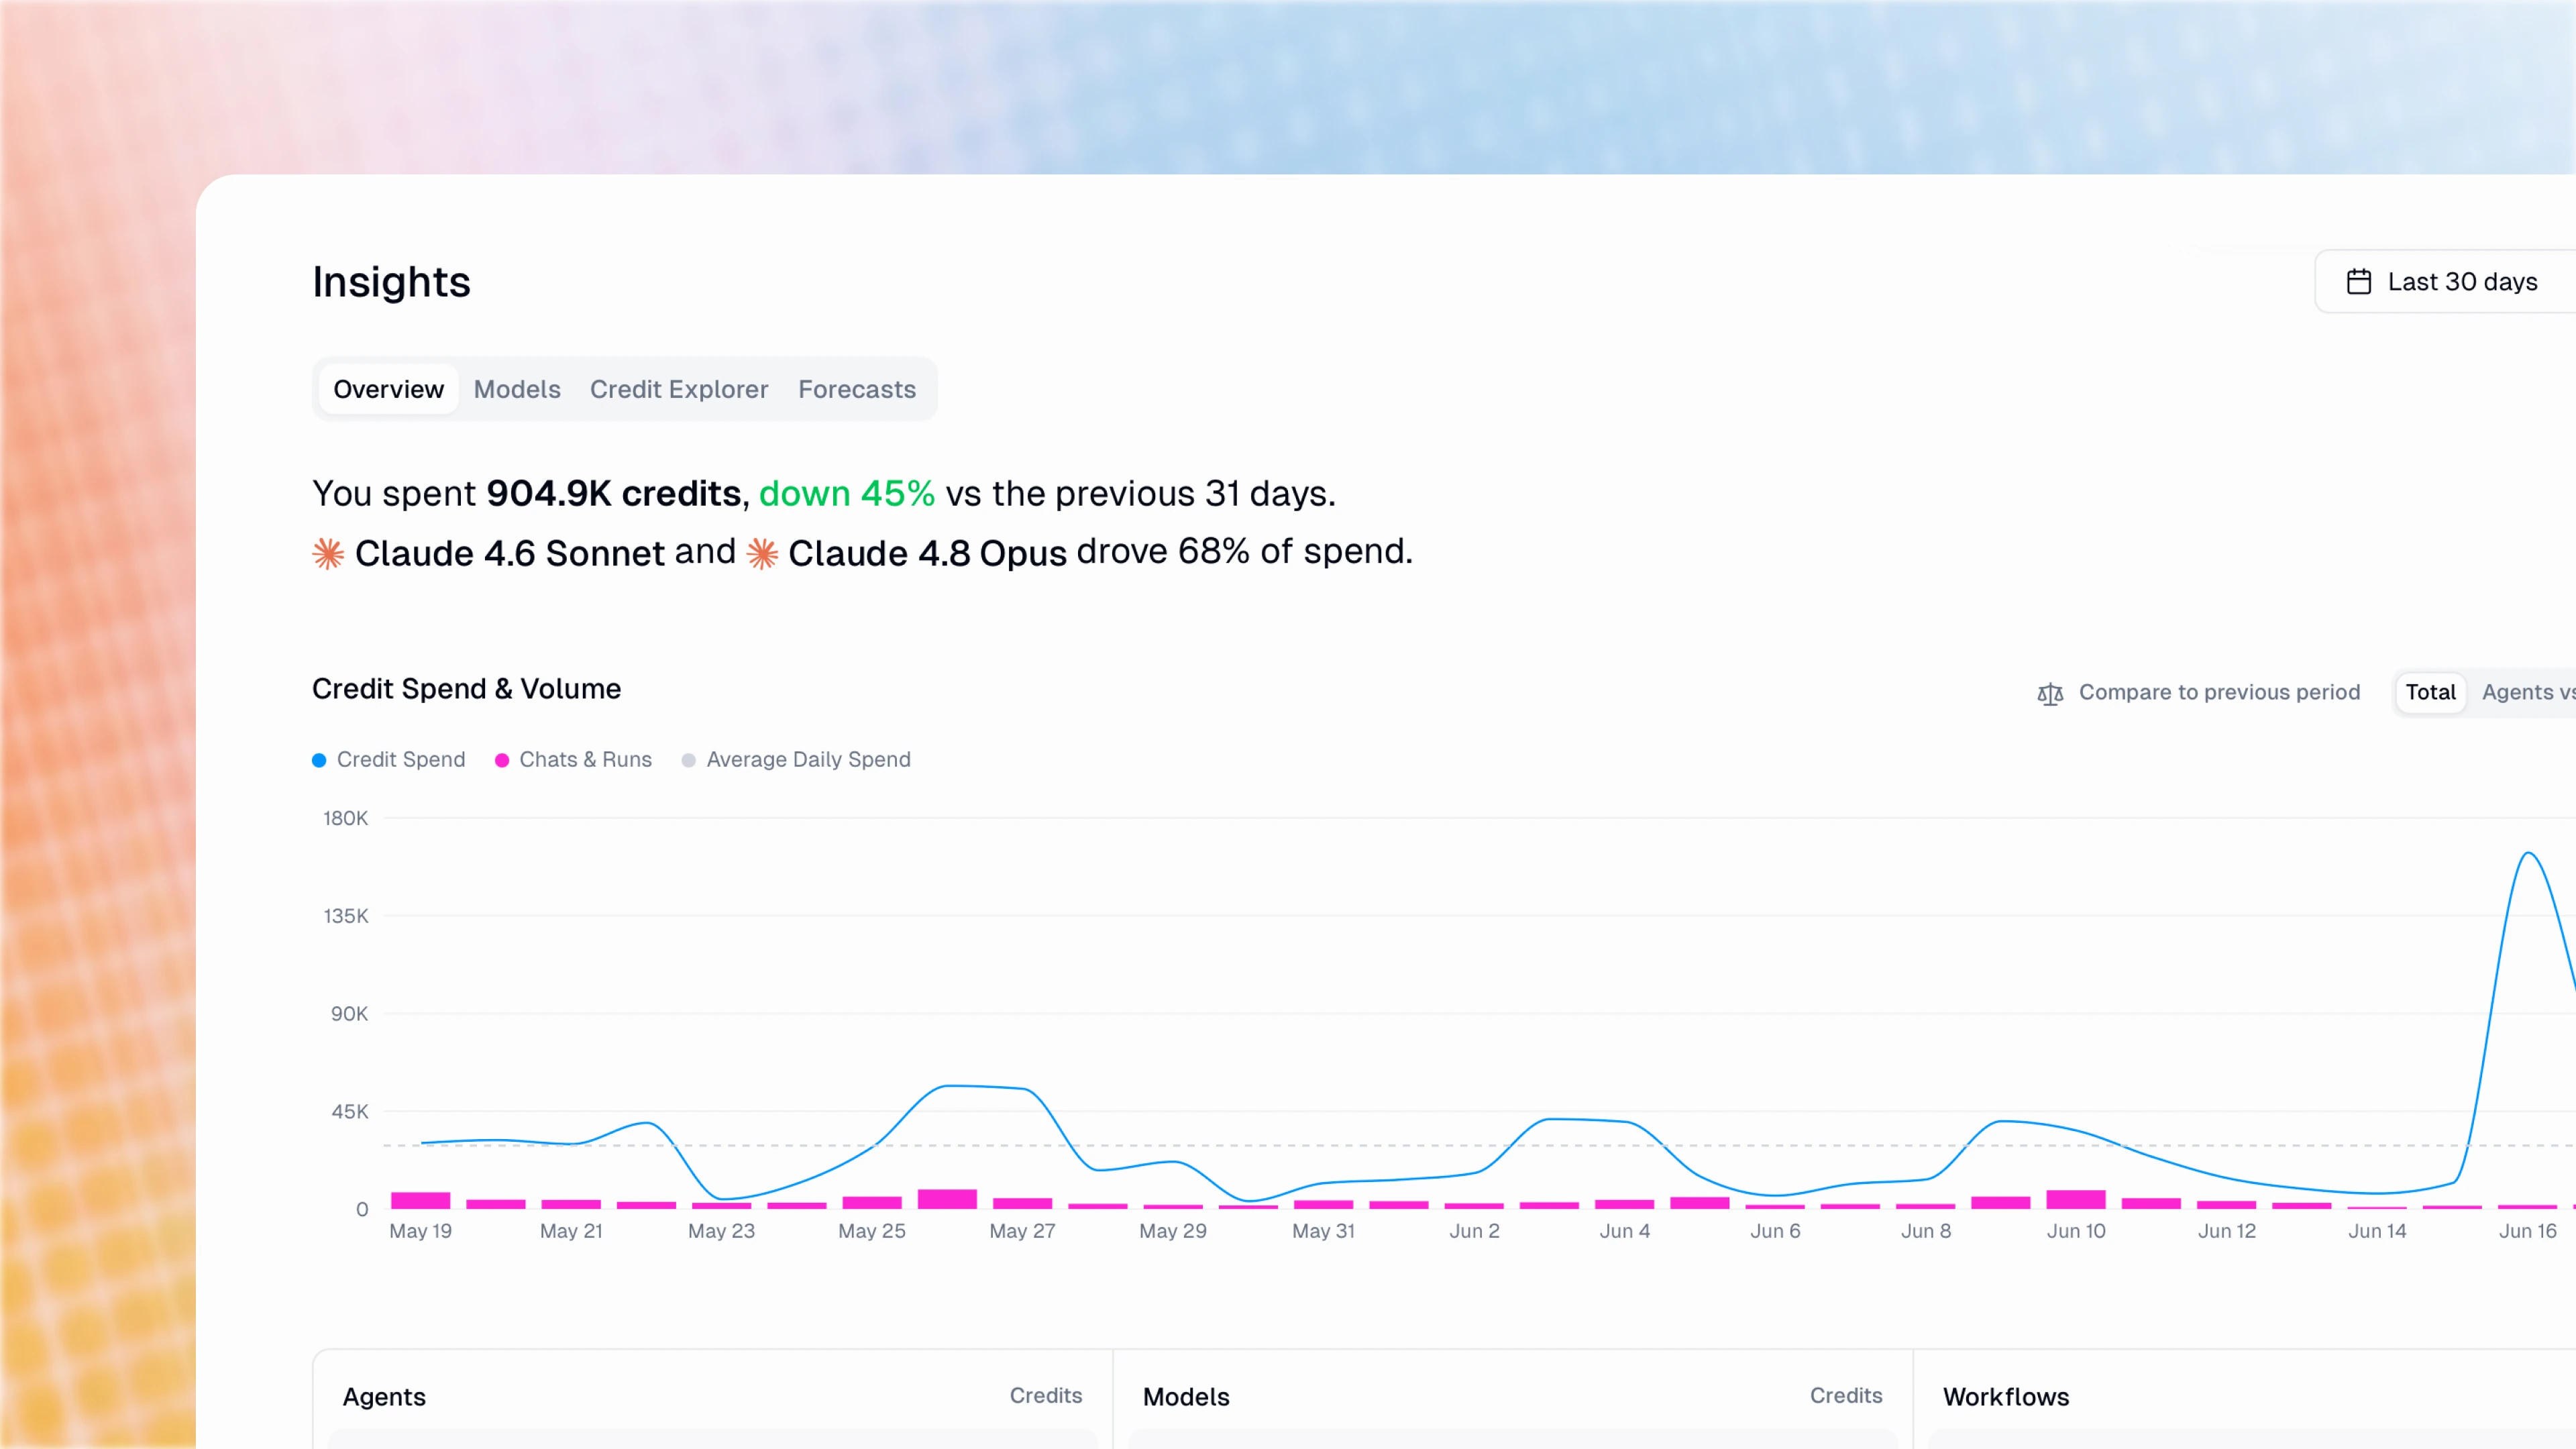
You can also see leaderboards of which agents and models are driving the most credit spend, and see how much spend is attributable to each user.
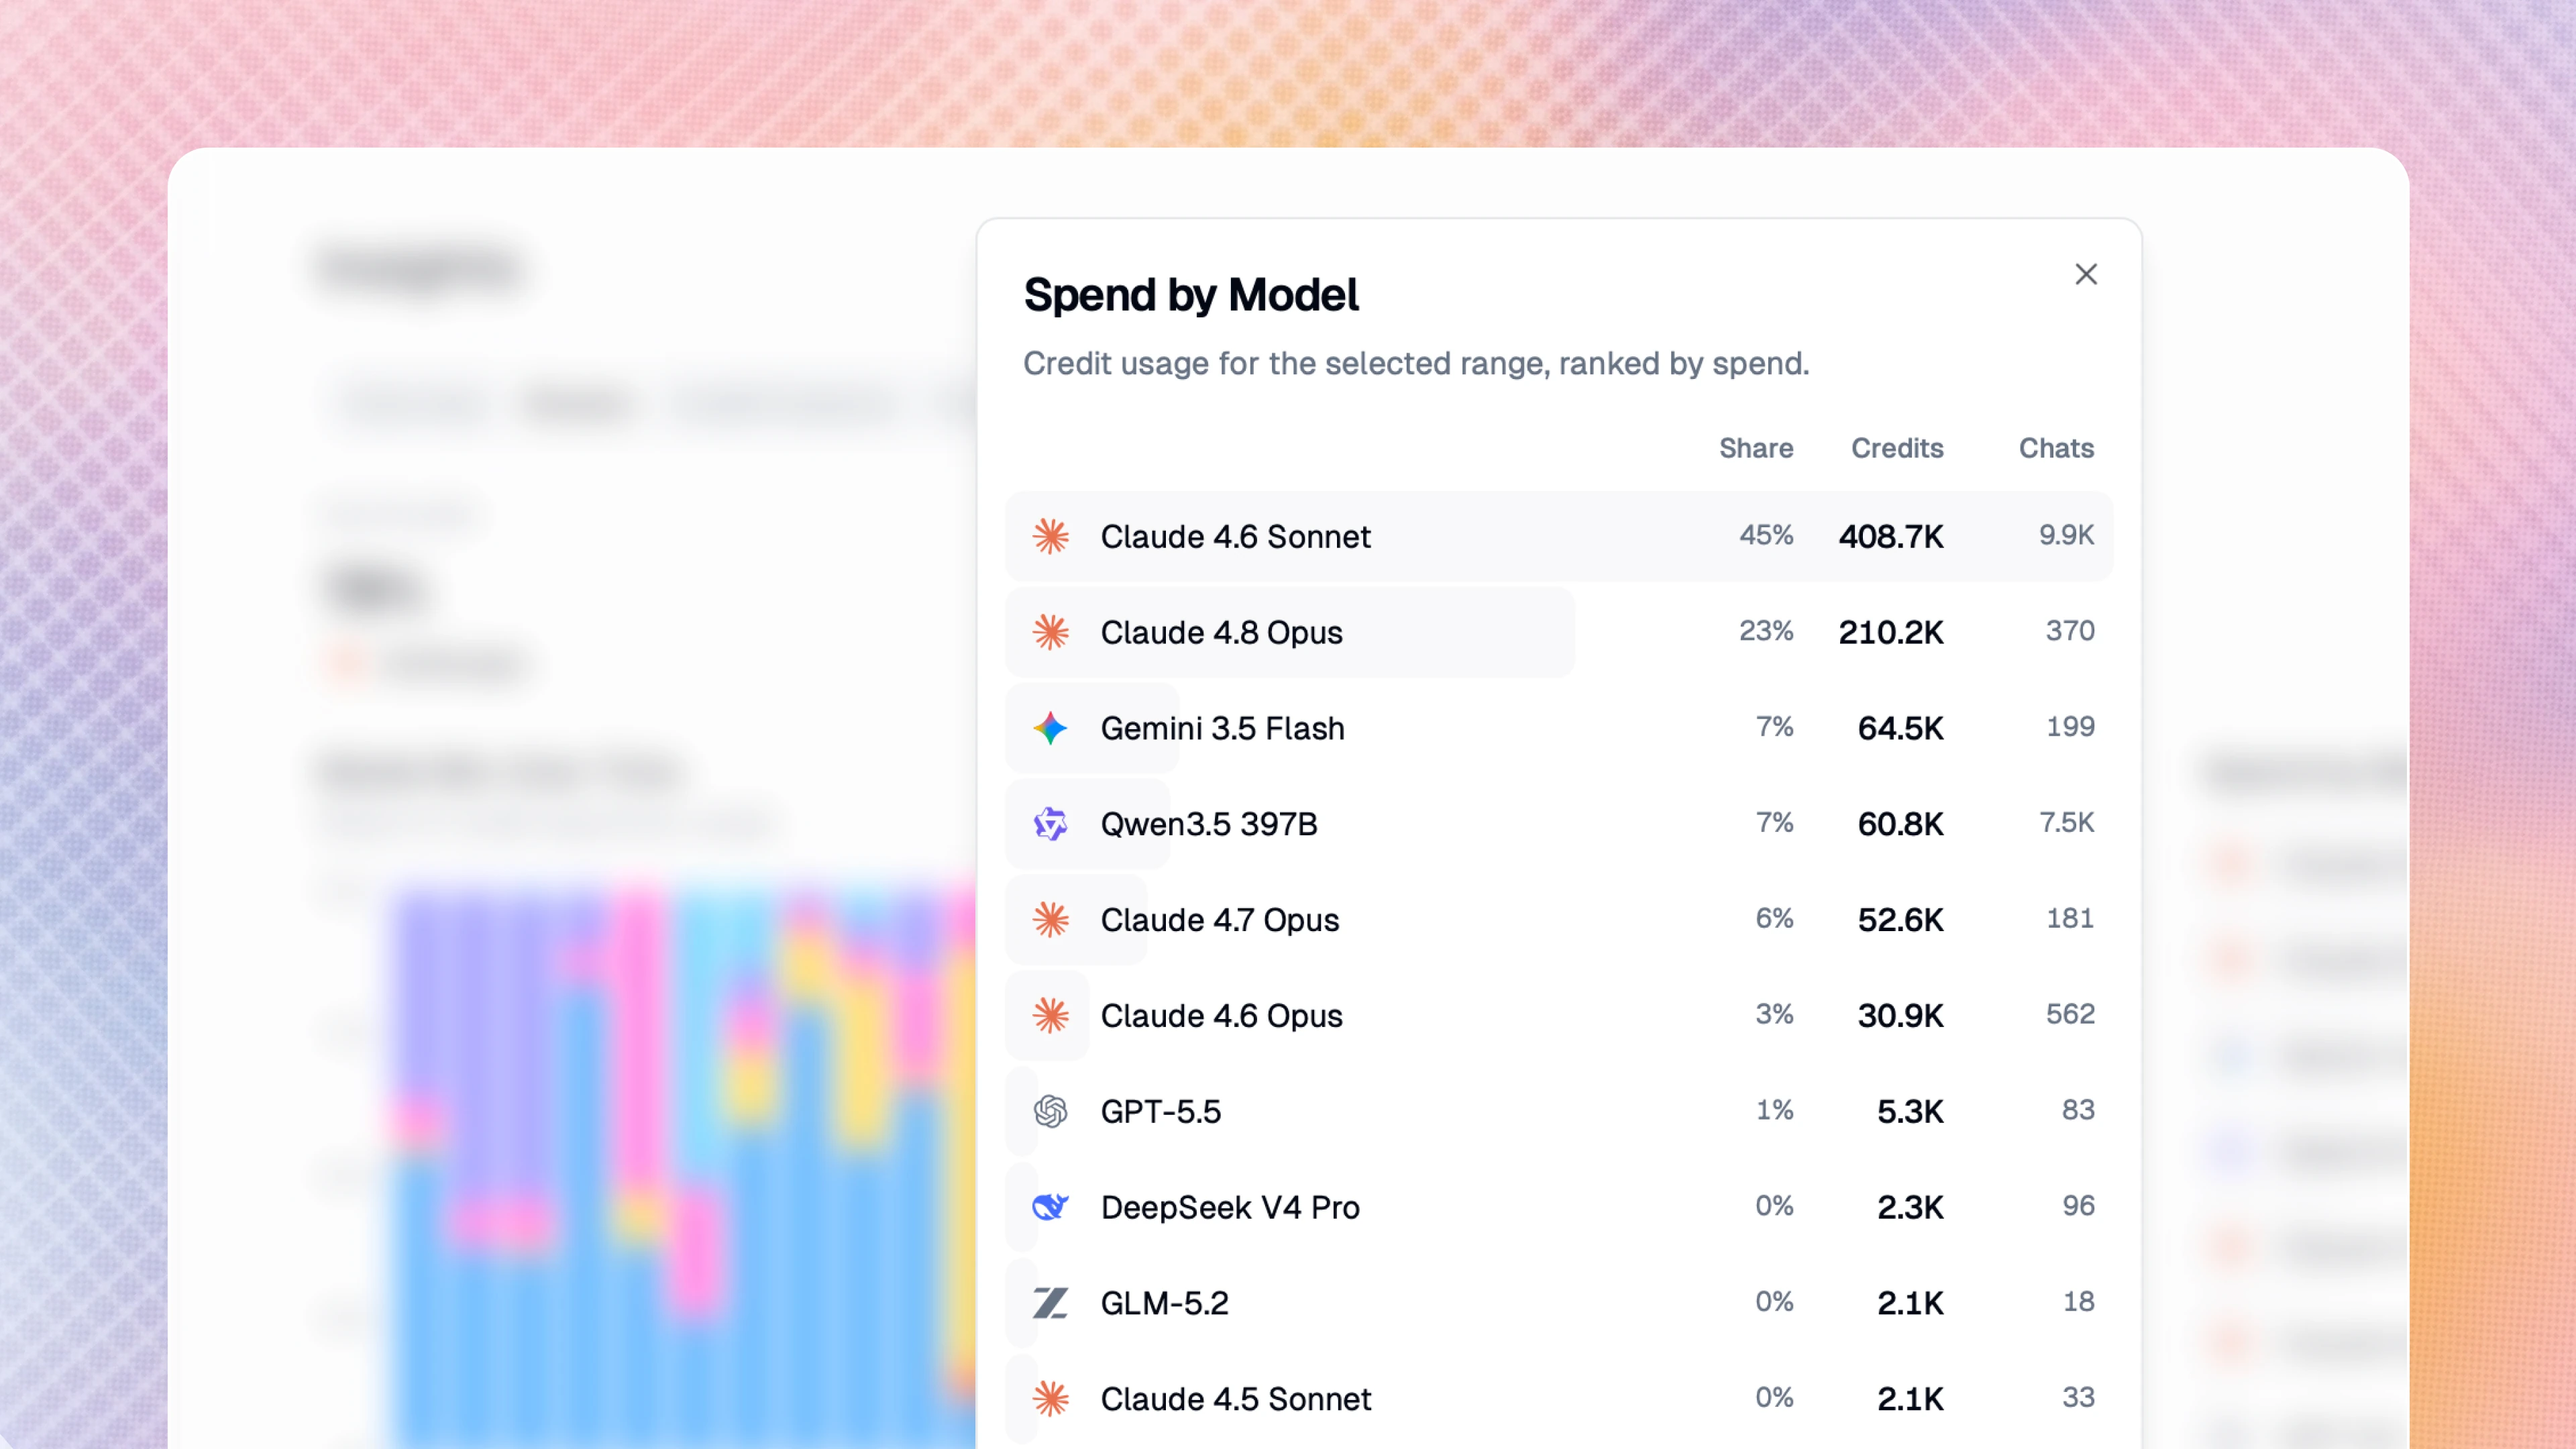
See spend by model
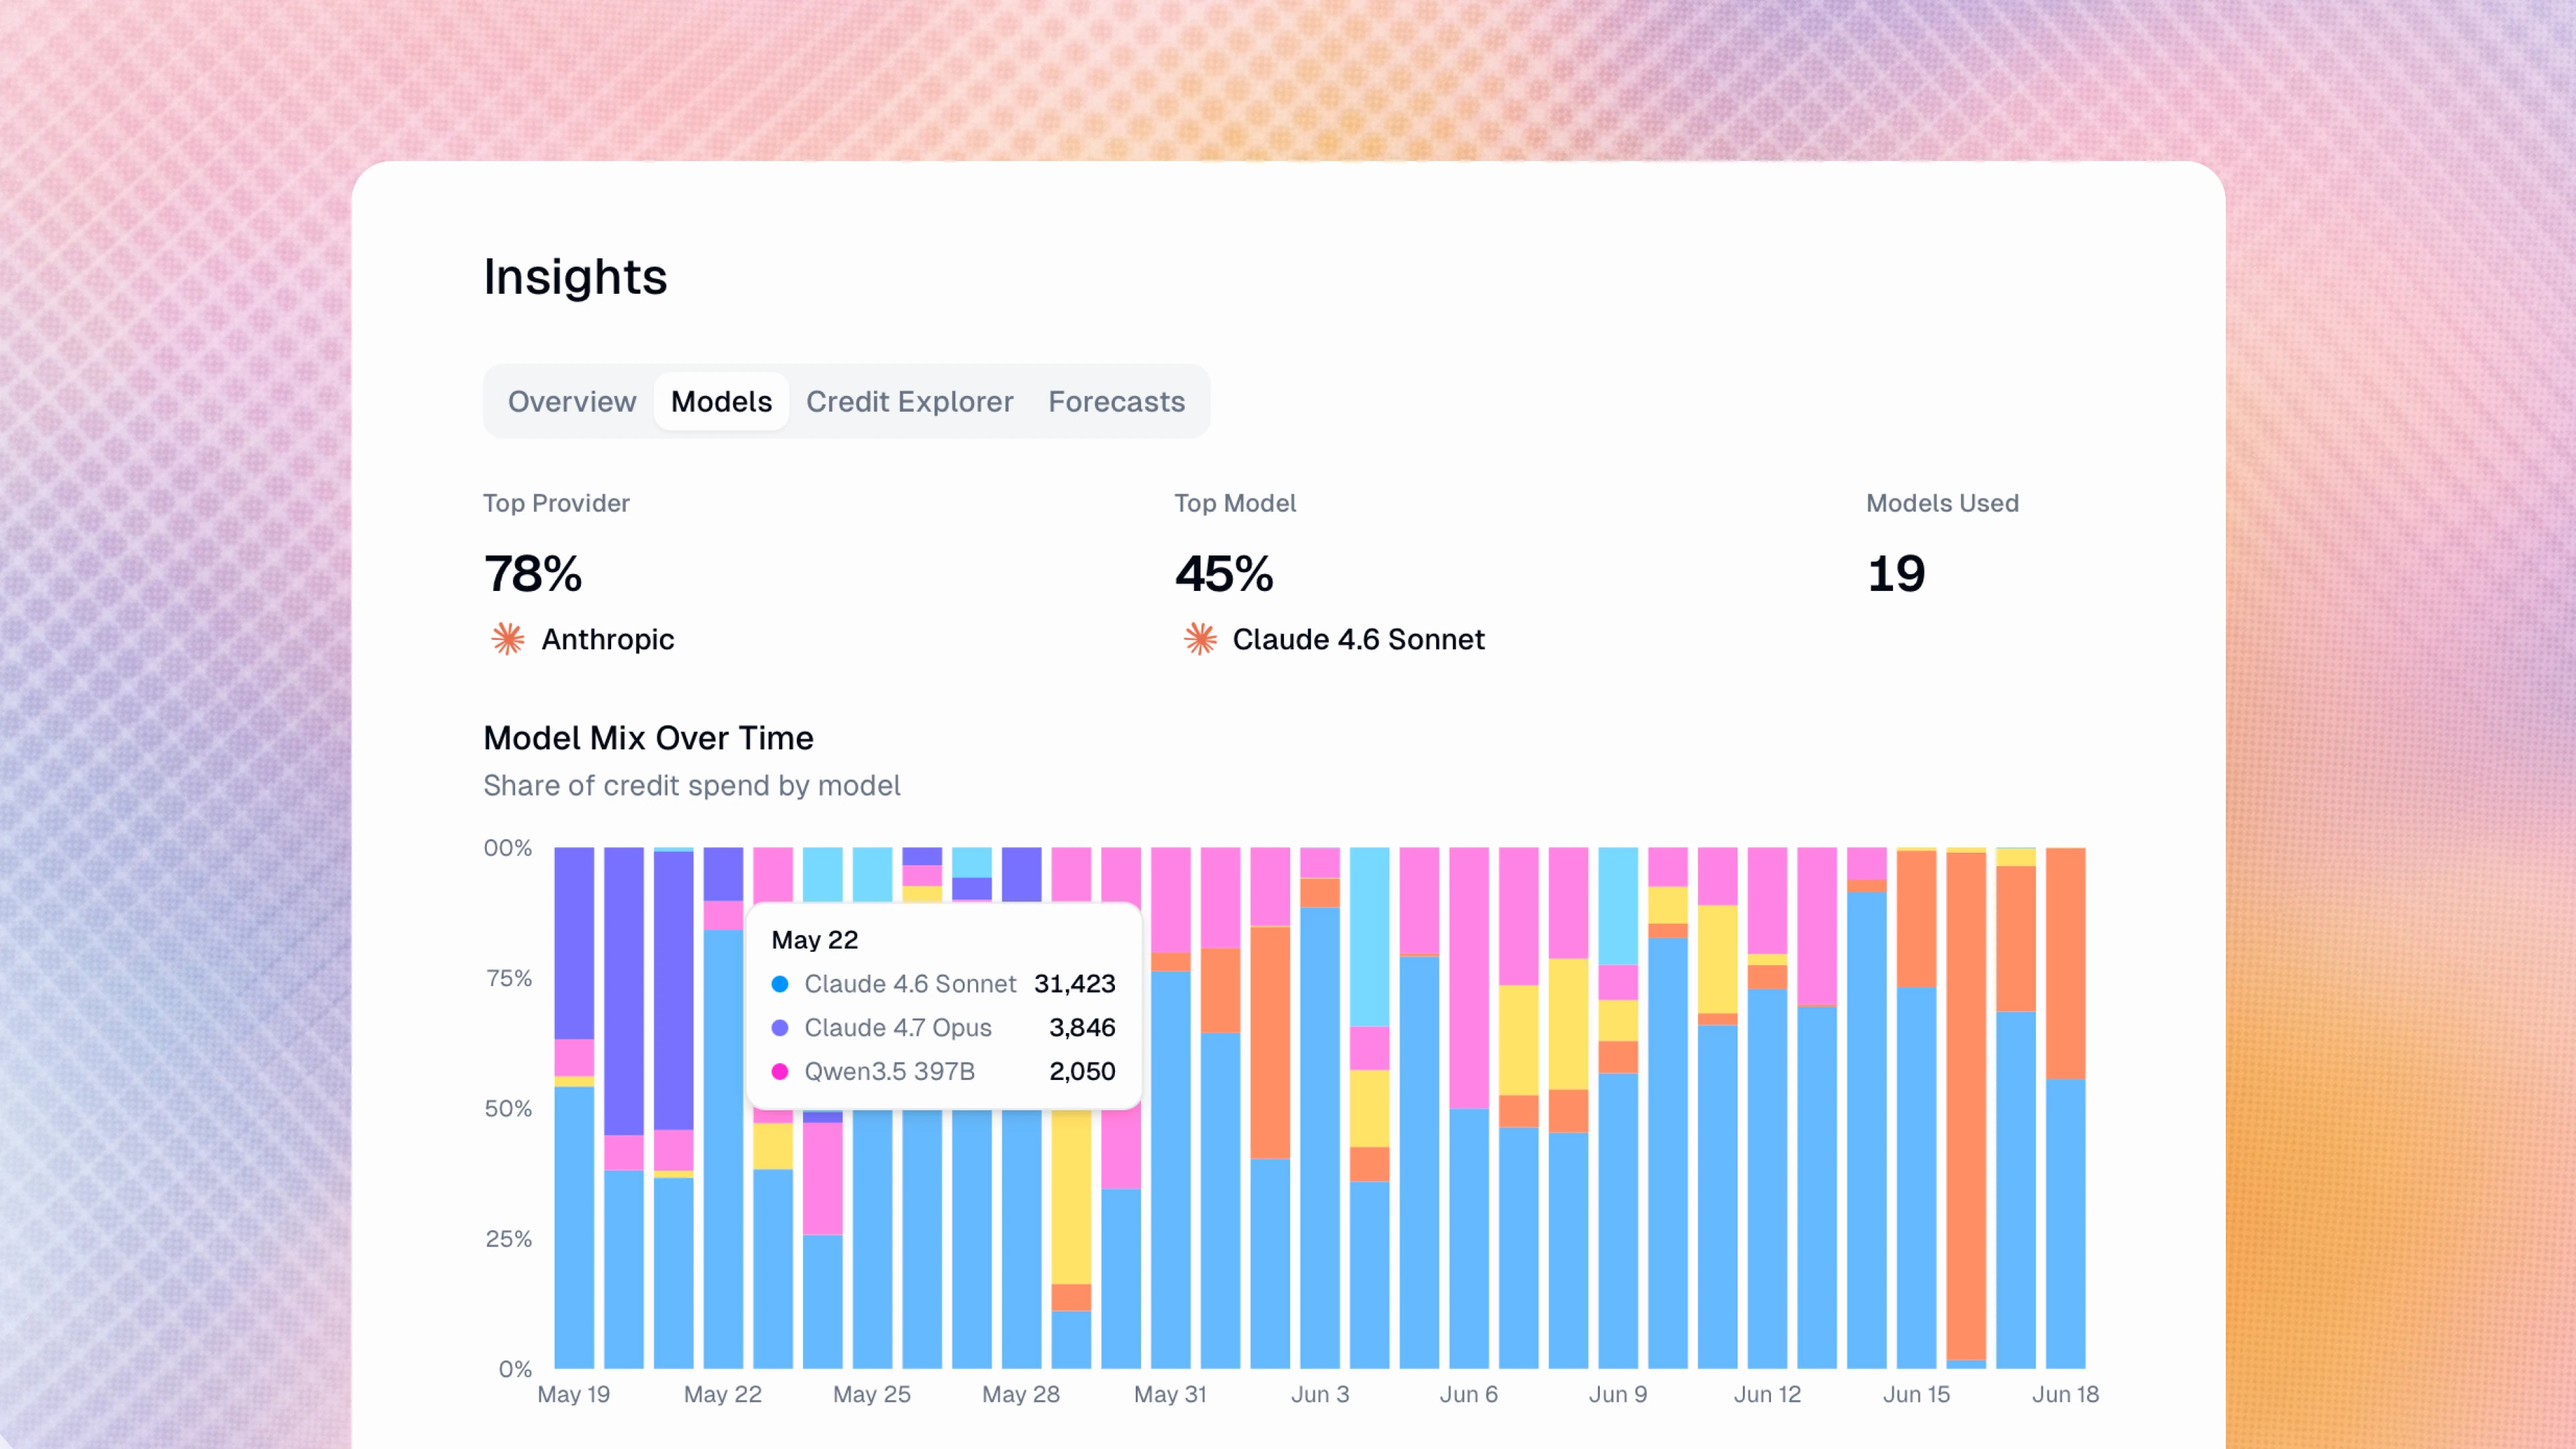
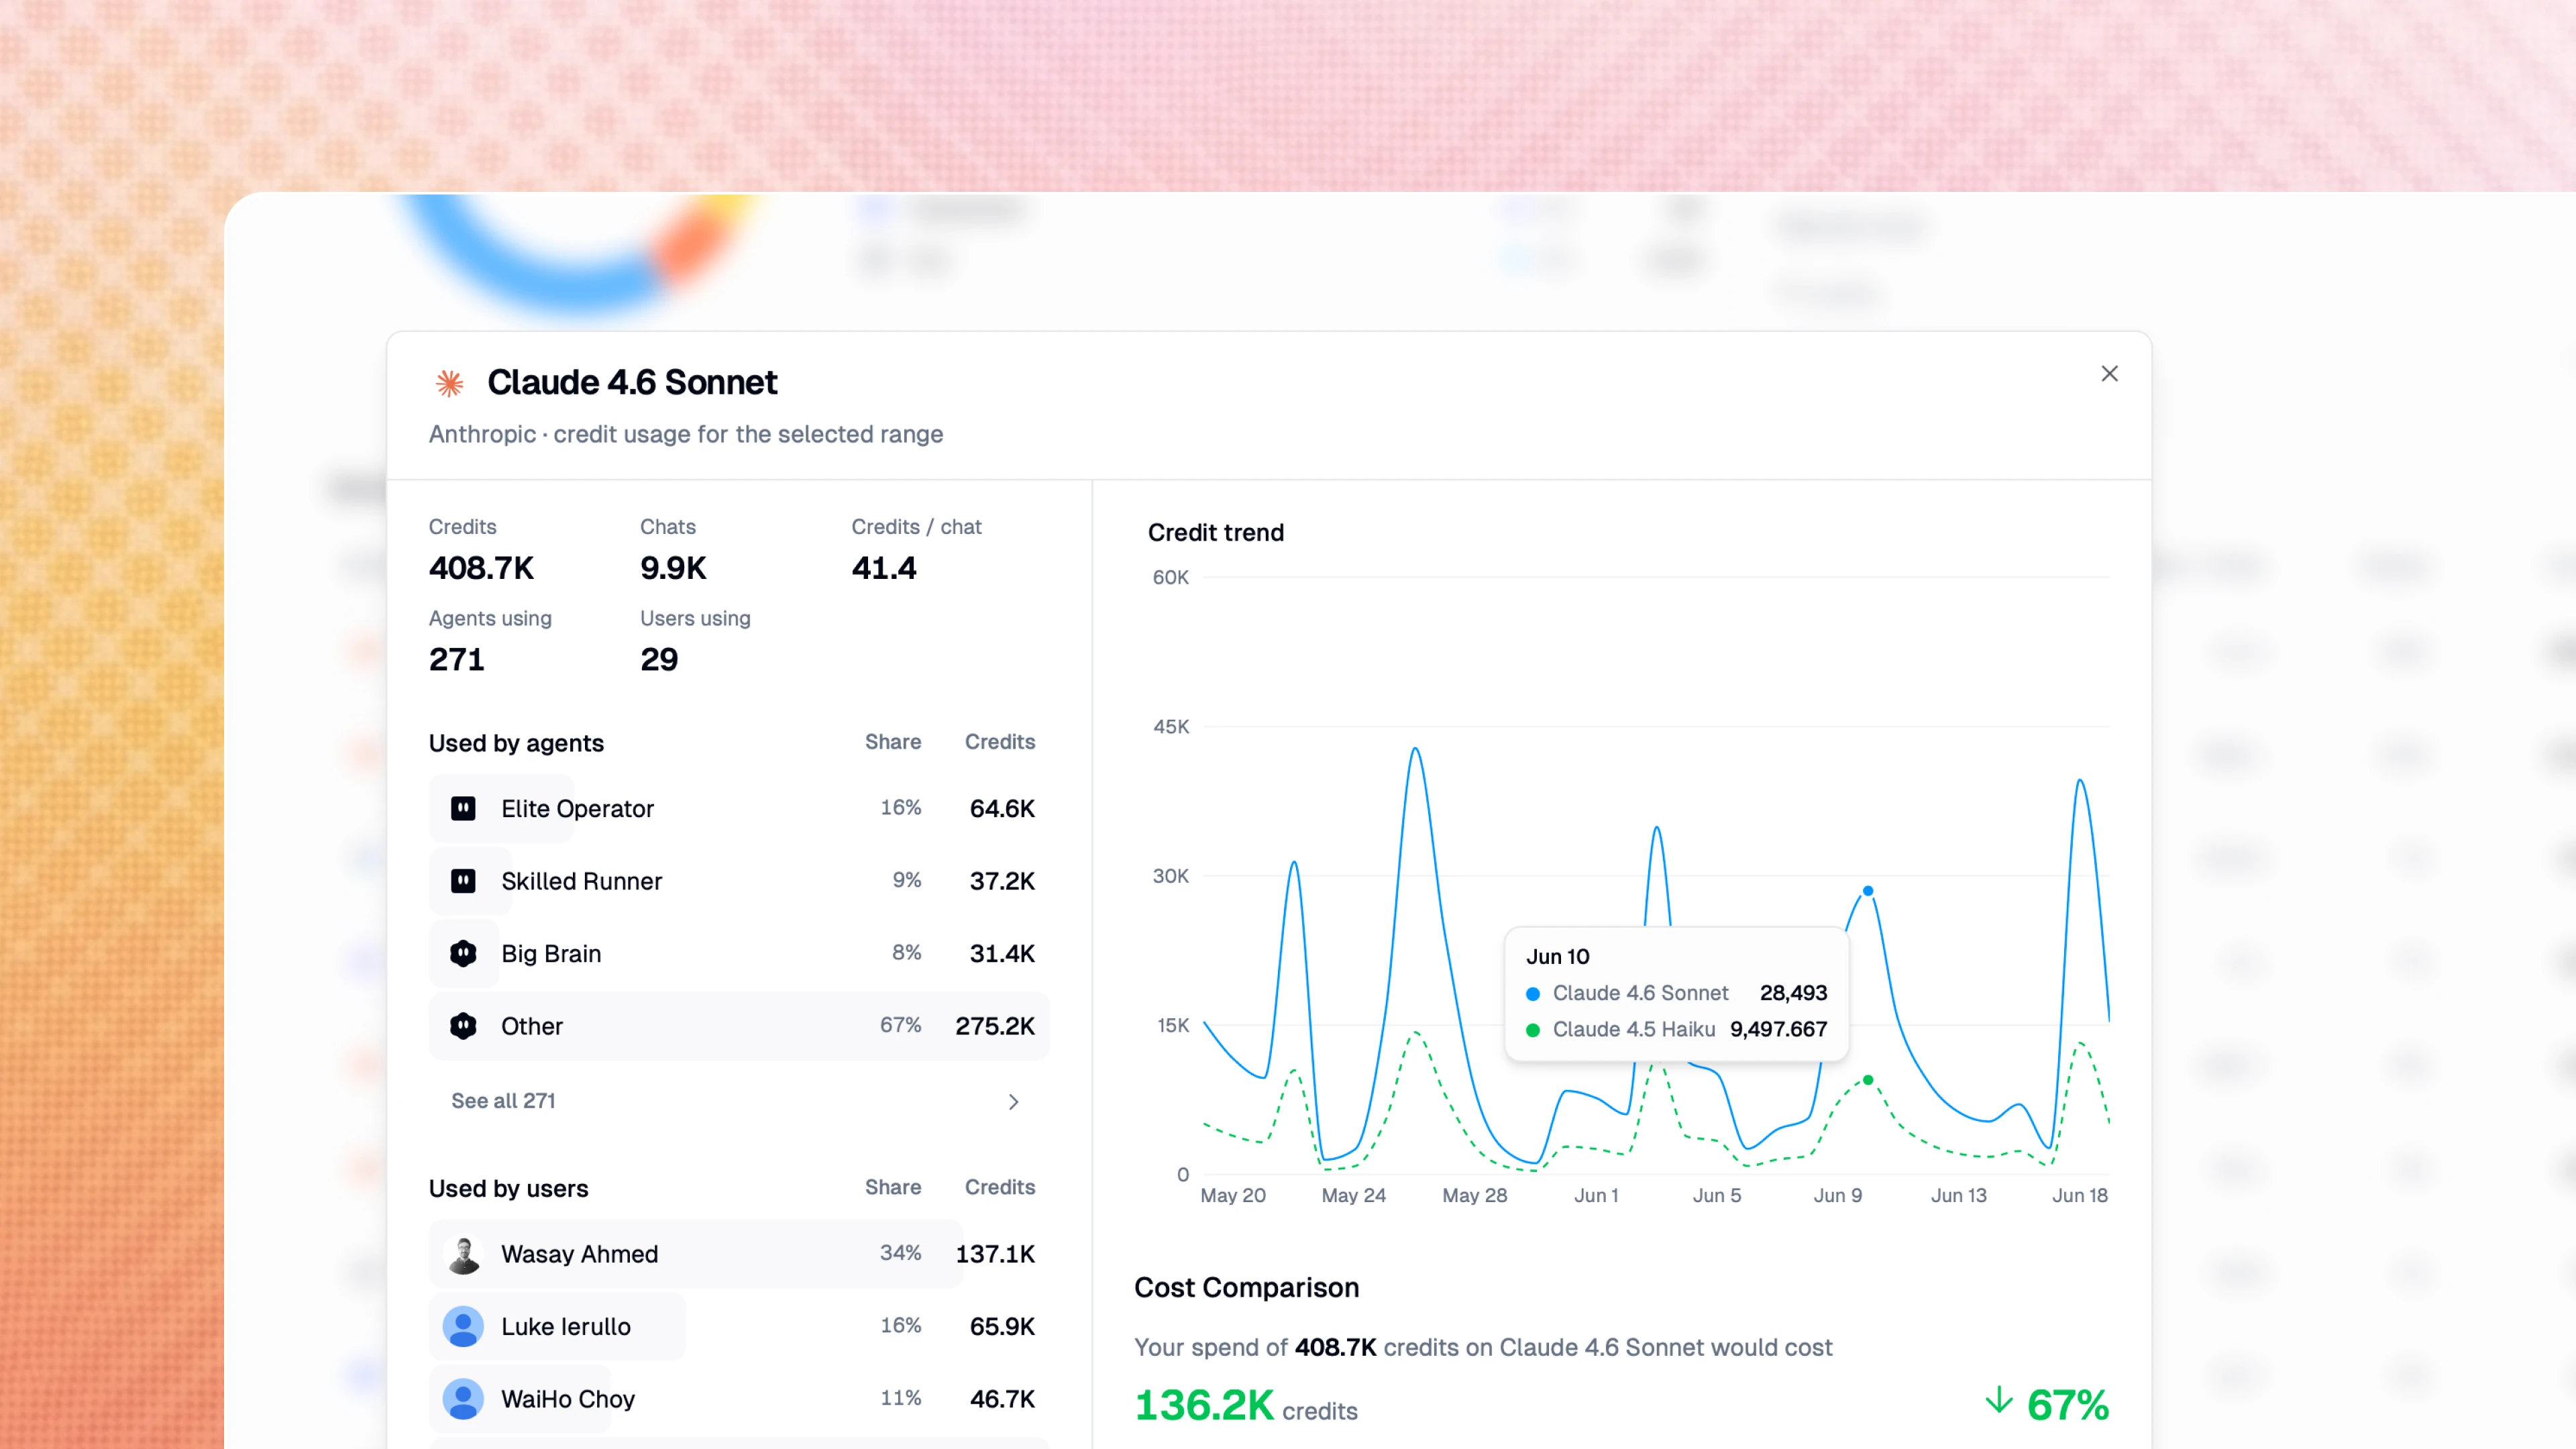
In the Models section of the Insights panel, you can break down your spend by model and provider. A sortable per-model table reveals which agents and users drive the cost for each model.
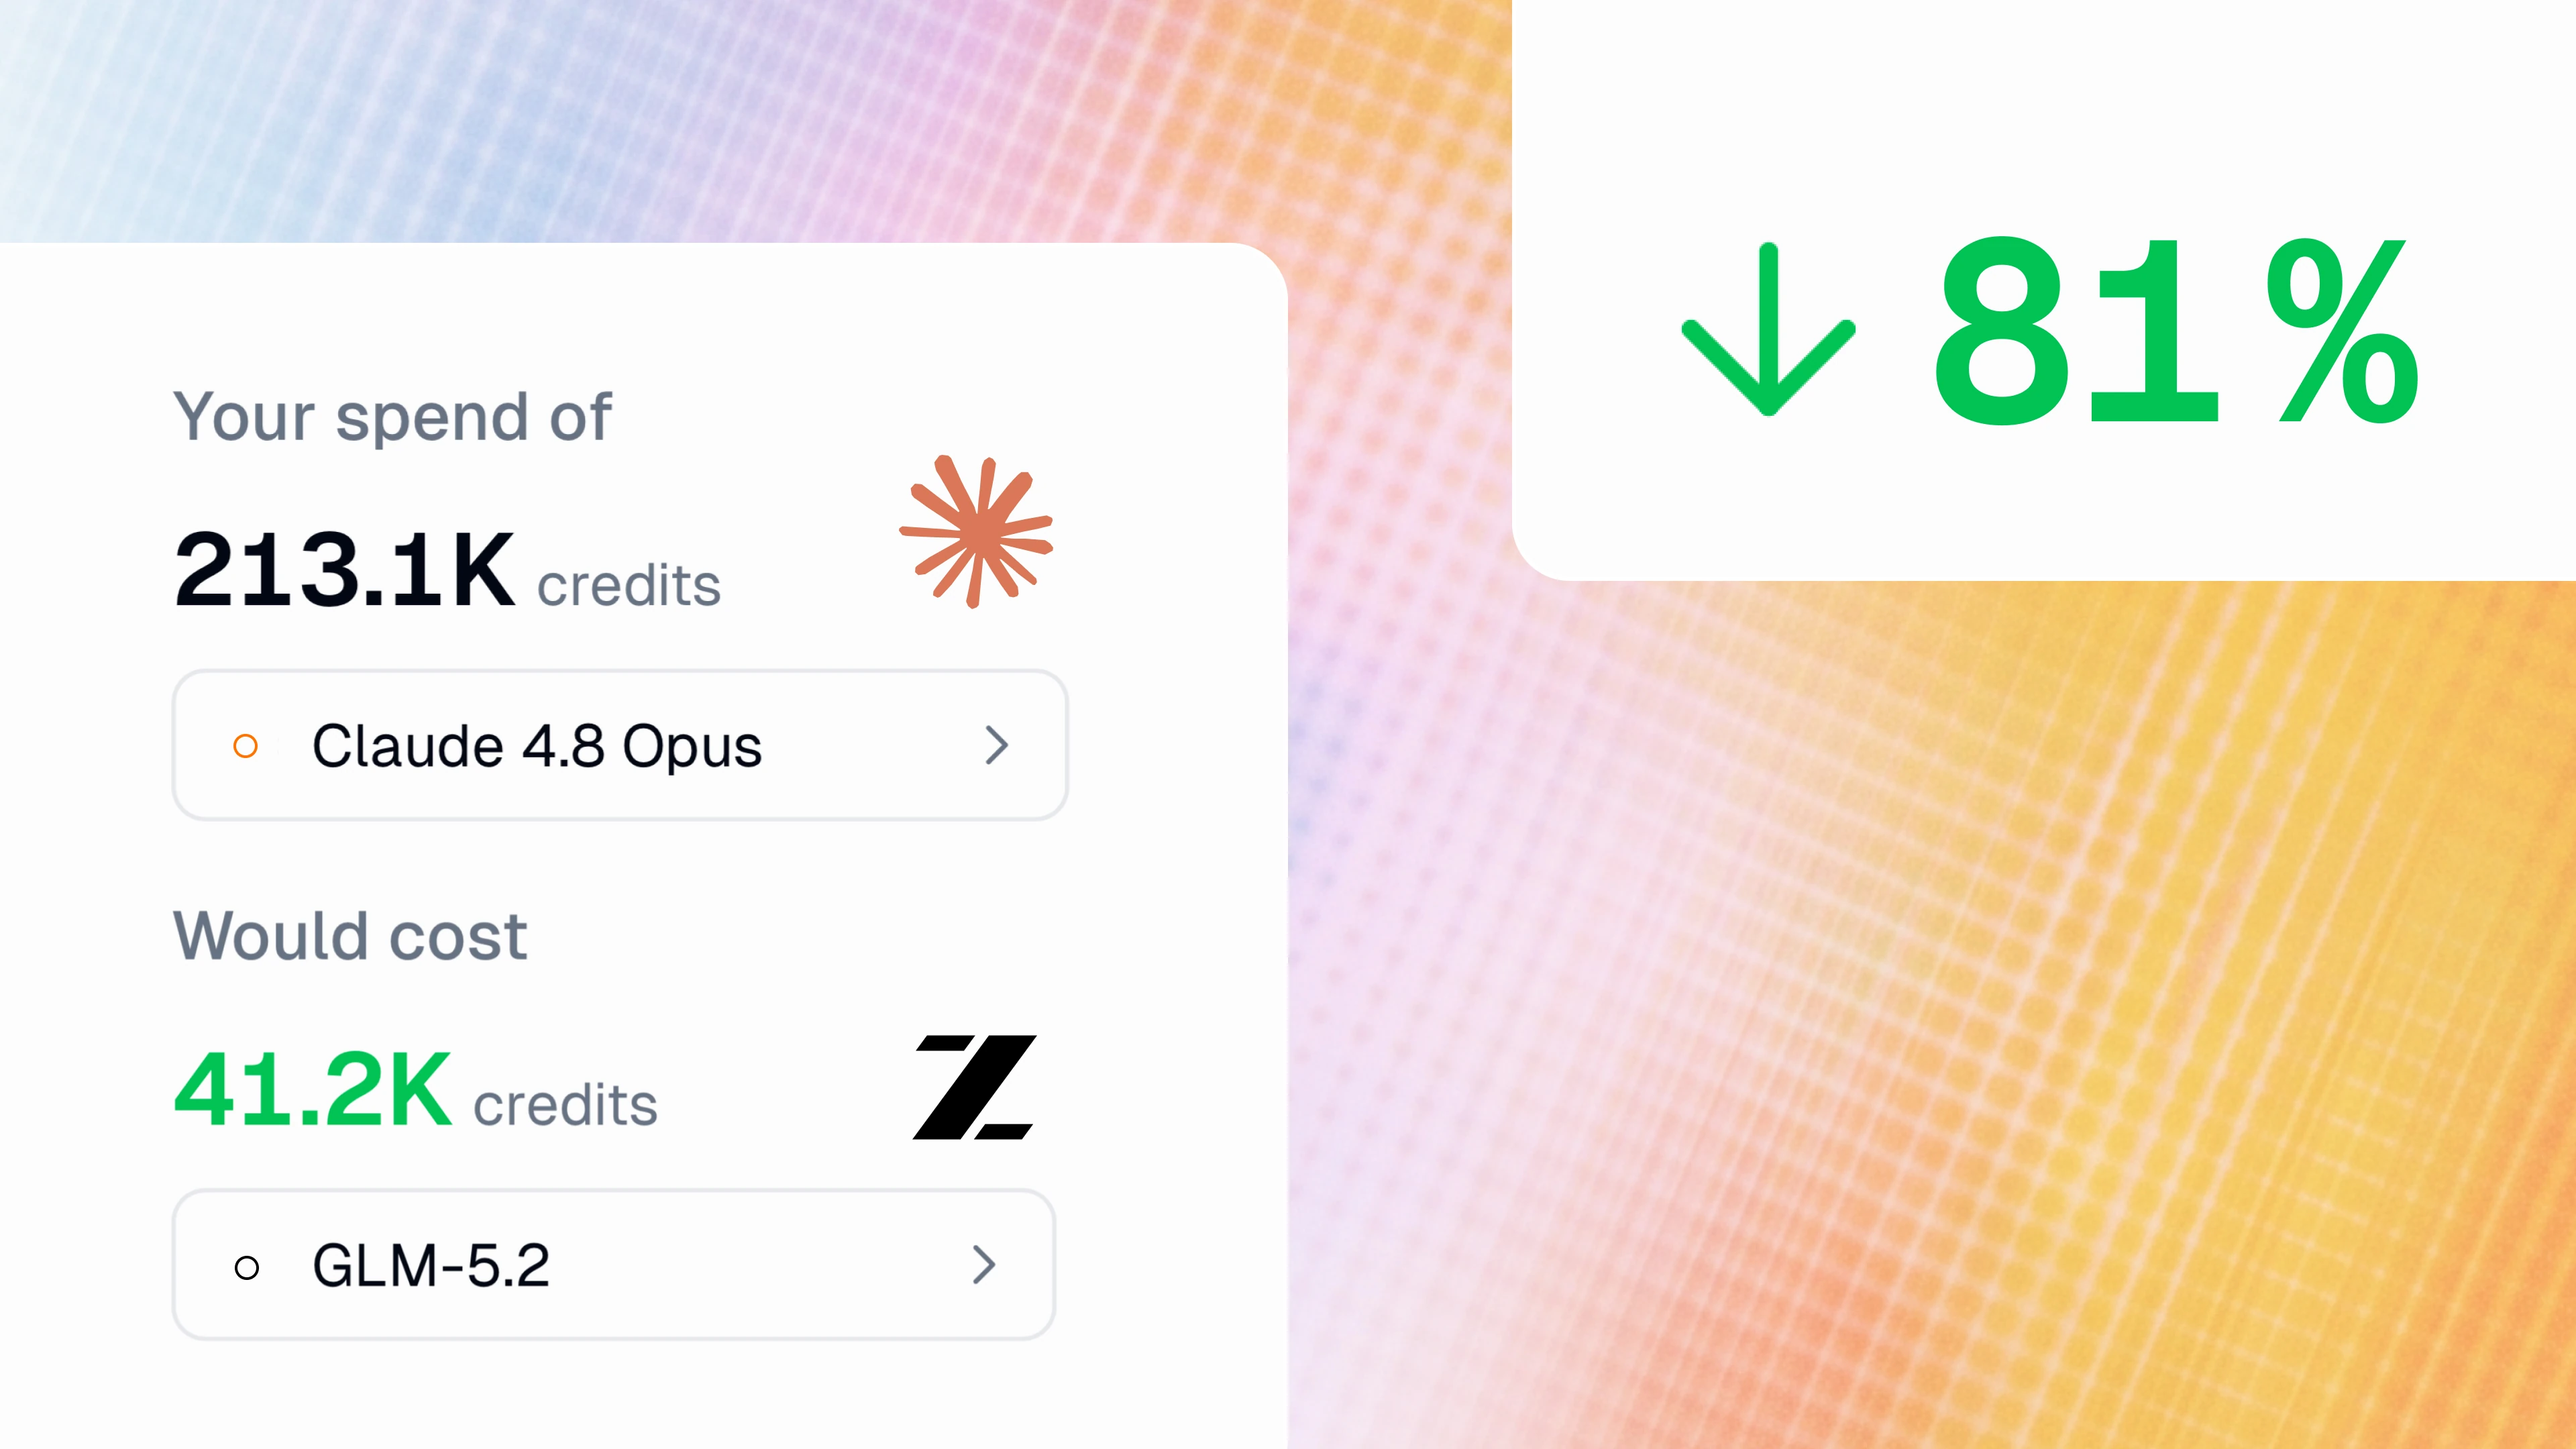
Perhaps the most important feature here is the Model Cost Calculator: pick any model you're currently using, and instantly see what that same spend would have cost if you had used a different model.
Insights will even give you specific savings recommendations: it automatically identifies and surfaces cheaper same-provider alternatives within a comparable intelligence tier.
Drill down to every agent and every user
The Credit Explorer section gives you a pivot table to group credit spend by agents, users, and models. Expand any row to see full details, all the way down to individual interactions with credit counts, models used, and exact costs. Rows link straight to the relevant agent, so you can identify and address problematic/overly expensive agent behavior immediately.
Forecast future spend based on real data
Insights can also project your future credit spend across a quarter, half-year, or year, with three projection lines: an expected trend, a conservative flat run-rate, and a confidence band around them.
The forecast is changepoint-aware, so if your usage jumped three weeks ago, Insights detects that shift and forecasts from the new level. That way, a recent scale-up doesn't get diluted by months of older, lower usage. It also flags when a prior period contained an anomalous spike, so your "vs. previous period" comparison stays honest instead of misleadingly large. (Forecasts need about six weeks of history for a trend projection.)
Insights lives under Organization settings and is available to org admins on Enterprise plans only.

Read related articles
Check out more articles on the Gumloop blog.